Project Overview
This initiative centers on developing a comprehensive database for managing bird count data, empowering the League for the Protection of Birds (LPO) to effectively collect, analyze, and present critical information. Built on PostgreSQL, the database integrates smoothly with tools like Excel and Power BI, enhancing data analysis and visualization.
The database modeling process began with creating an Entity-Relationship Diagram (ERD) to define key entities such as bird counts, observers, species, and locations, along with their relationships and constraints. This was succeeded by the Logical Data Model (LDM), which transformed the ERD into relational tables optimized for PostgreSQL.
During the setup phase, tables were created with specific constraints, including primary and foreign keys, to maintain data integrity. Simulated bird count records were then added to the database, and SQL queries were crafted for efficient data management and analysis.
Main Features
Database Modeling
Creation of an Entity-Relationship Diagram (ERD) and Logical Data Model (LDM) to effectively structure bird count data with their relationships and constraints.
PostgreSQL Database
Implementation of a robust database with integrity constraints, primary and foreign keys to ensure data consistency and quality.
Statistical Analysis with Excel
Data extraction and analysis in Excel to evaluate the number of individuals per species, geographic distribution of observations and population trends over time.
Power BI Dashboard
Development of an interactive report with Power BI displaying bird population trends, identifying areas of high biodiversity and facilitating annual or seasonal comparisons.
Optimized SQL Queries
Development of efficient SQL queries for data management and analysis, enabling fast and accurate extraction of relevant information.
Data Visualization
Creation of effective visualizations in Excel and Power BI to represent statistical results and facilitate understanding of trends and patterns.
Project Gallery
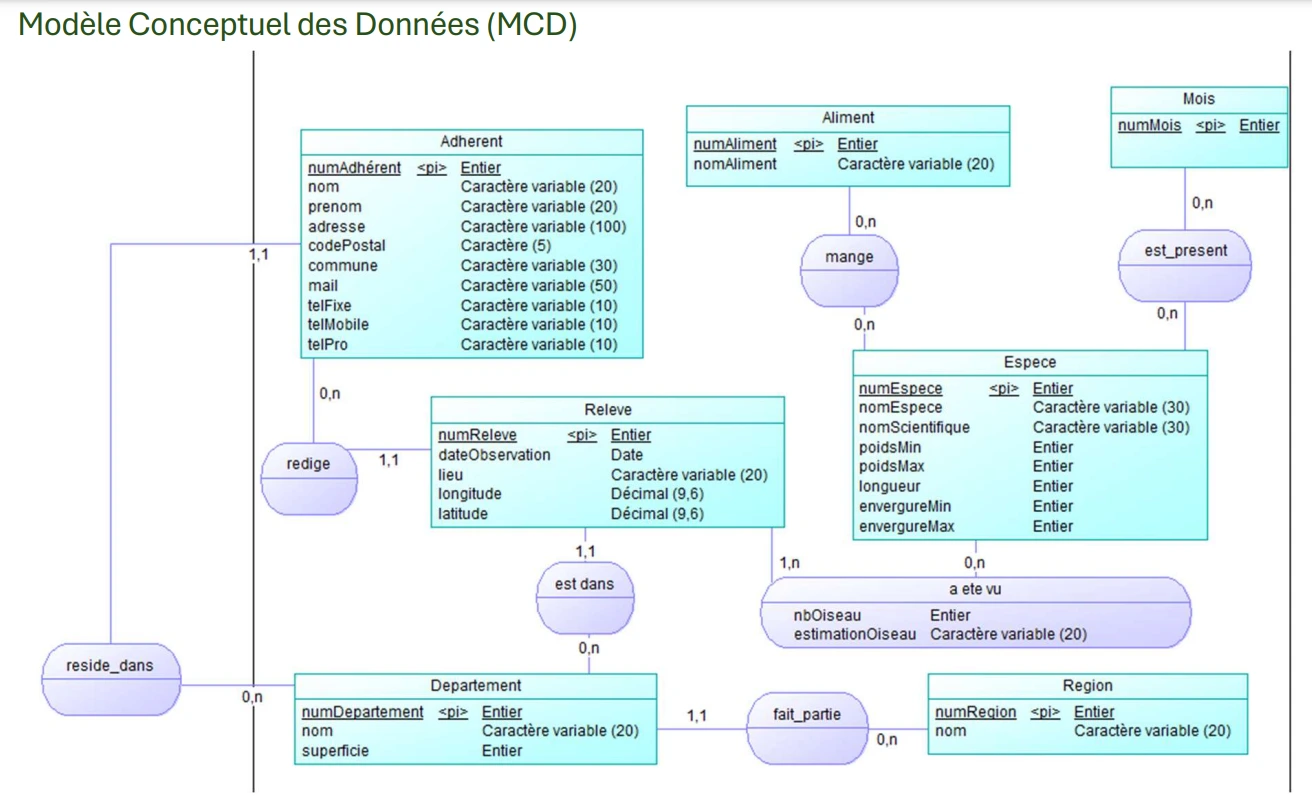
Entity-Relationship Diagram (ERD)
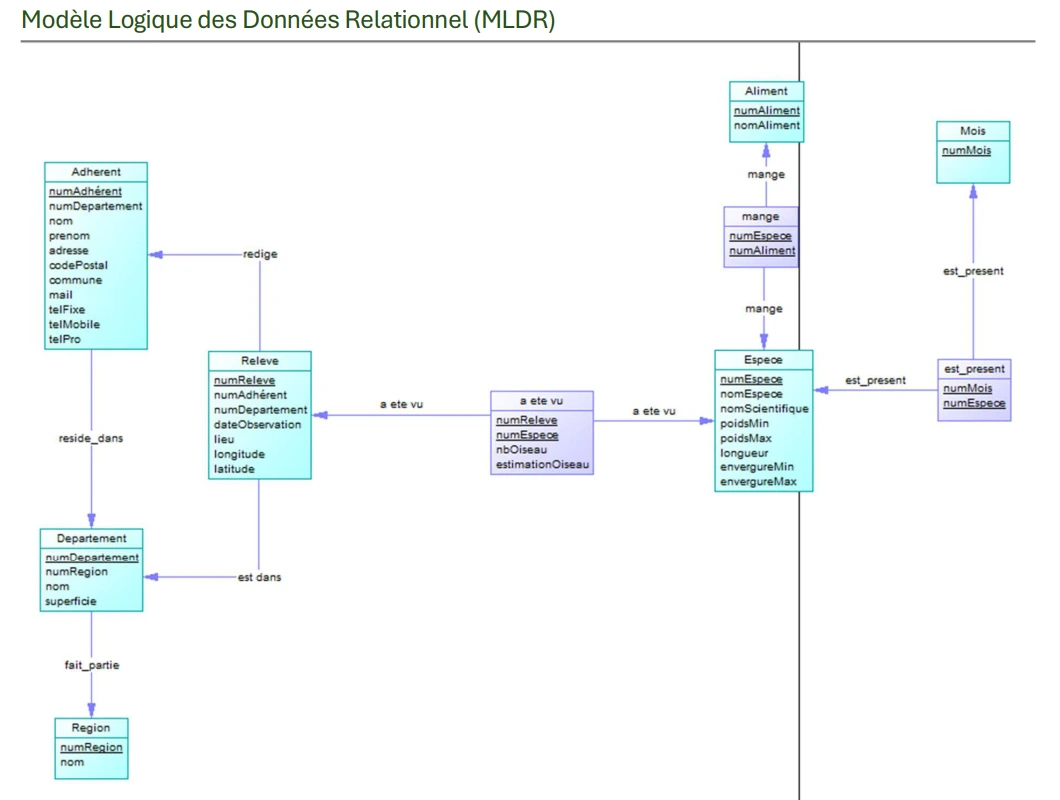
Logical Data Model (LDM)
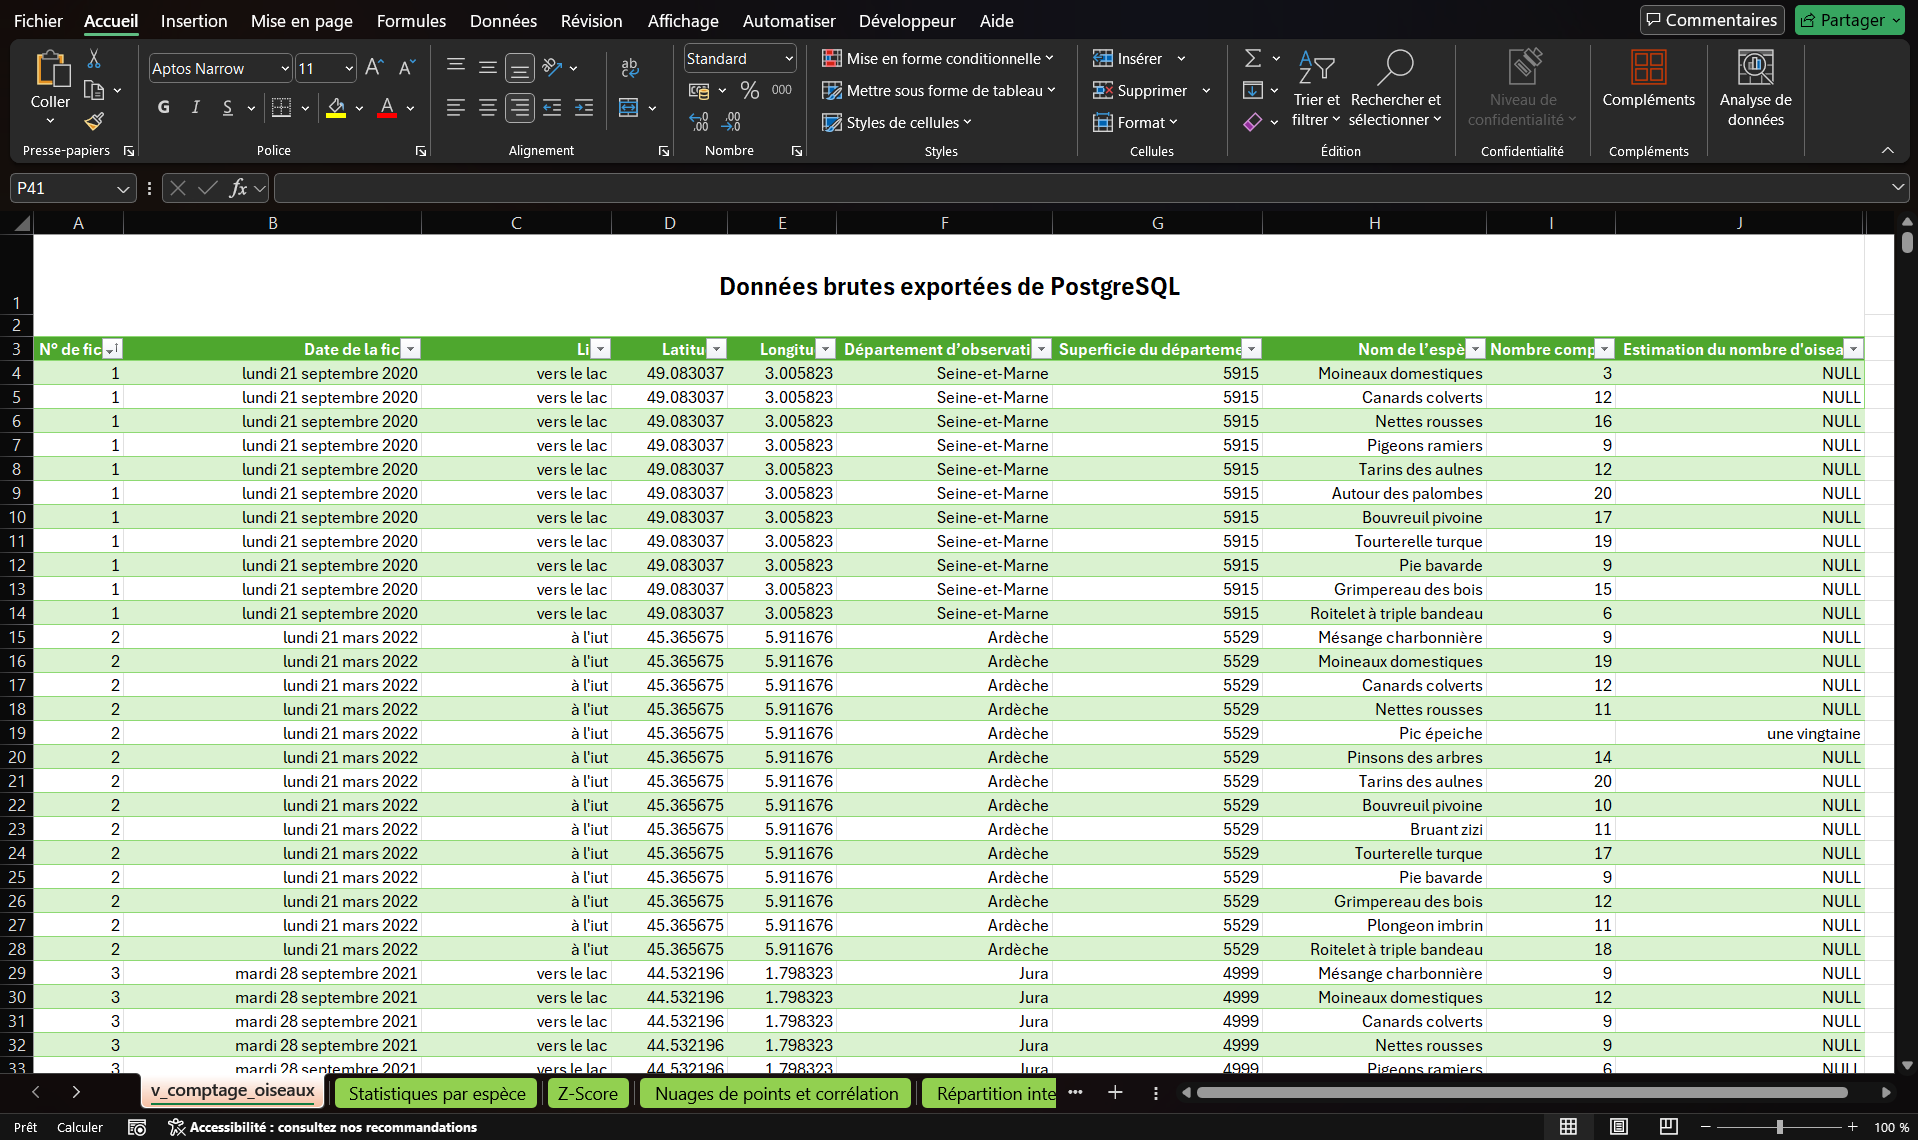
Statistical analysis with Excel
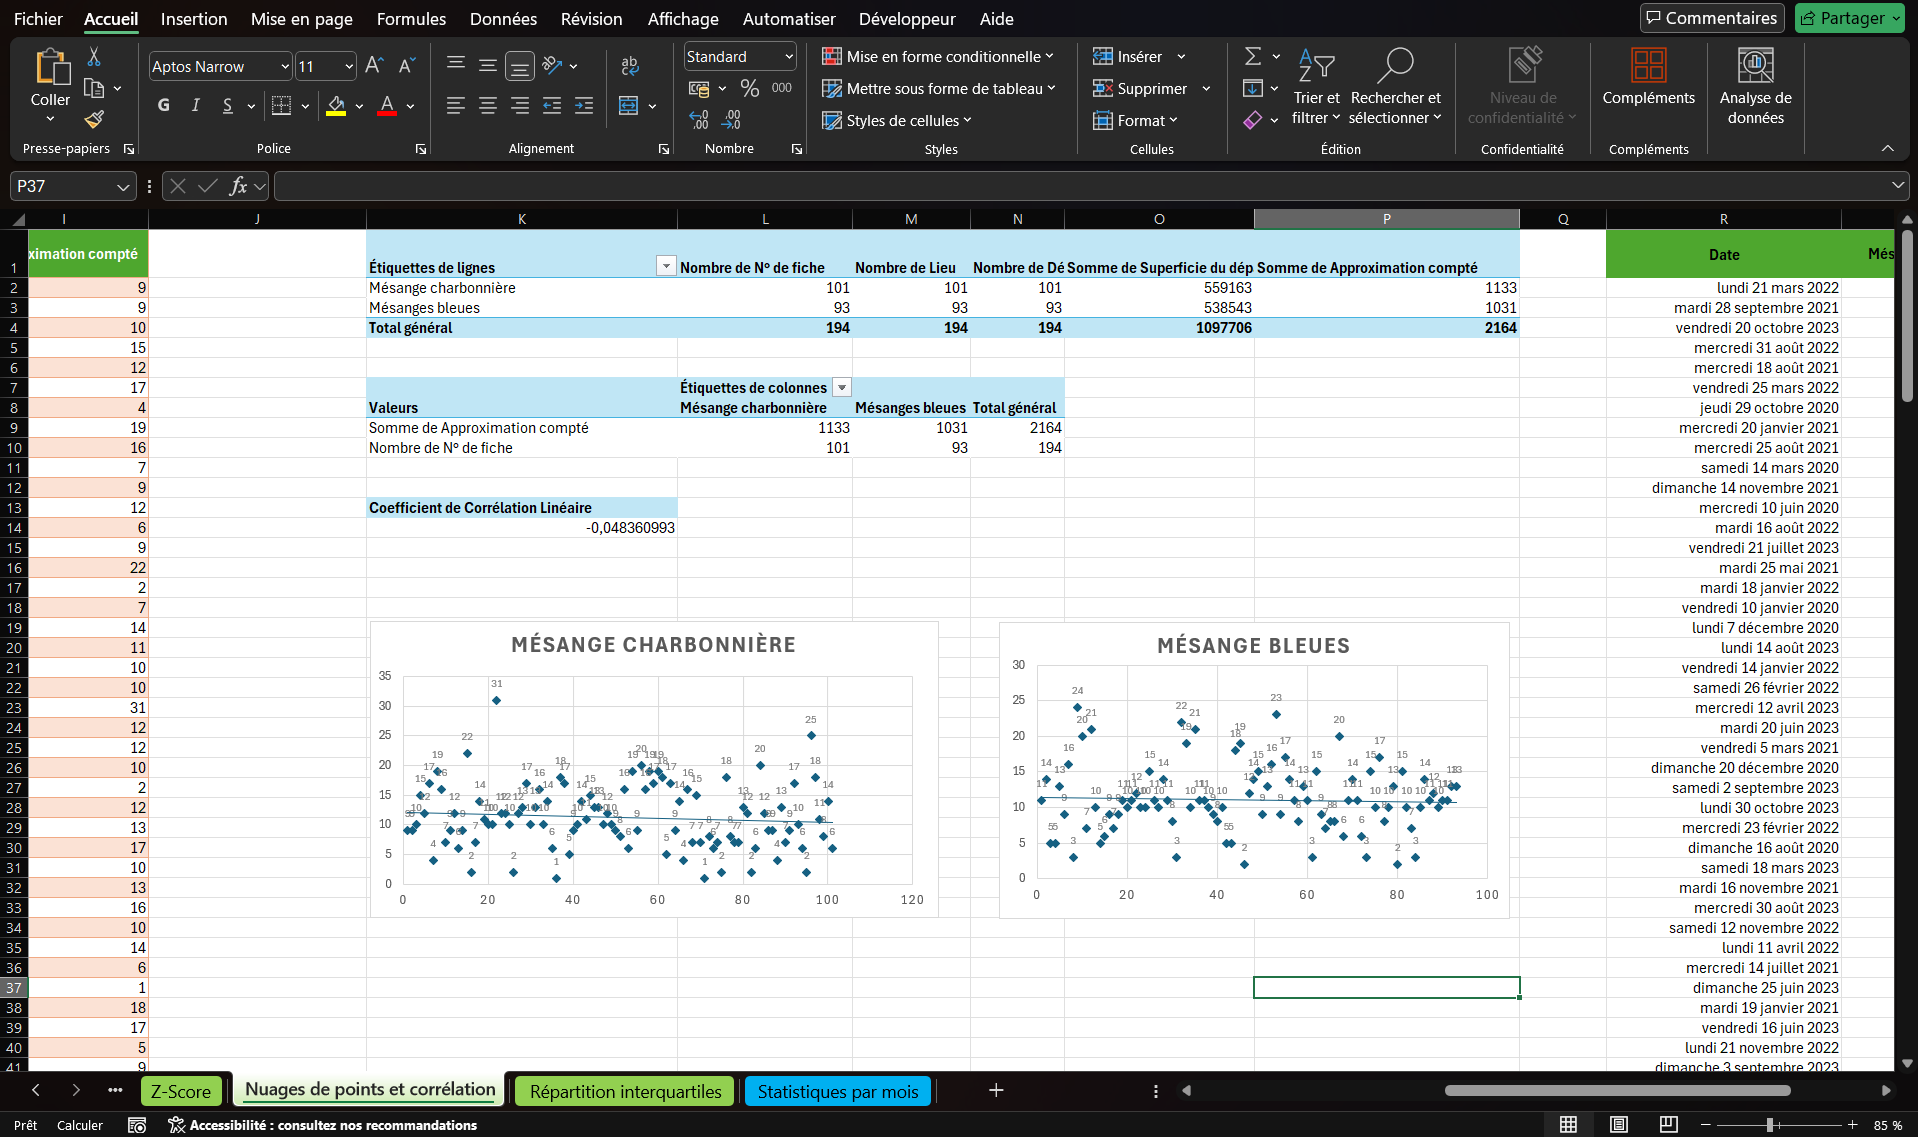
Visualizations and statistics in Excel
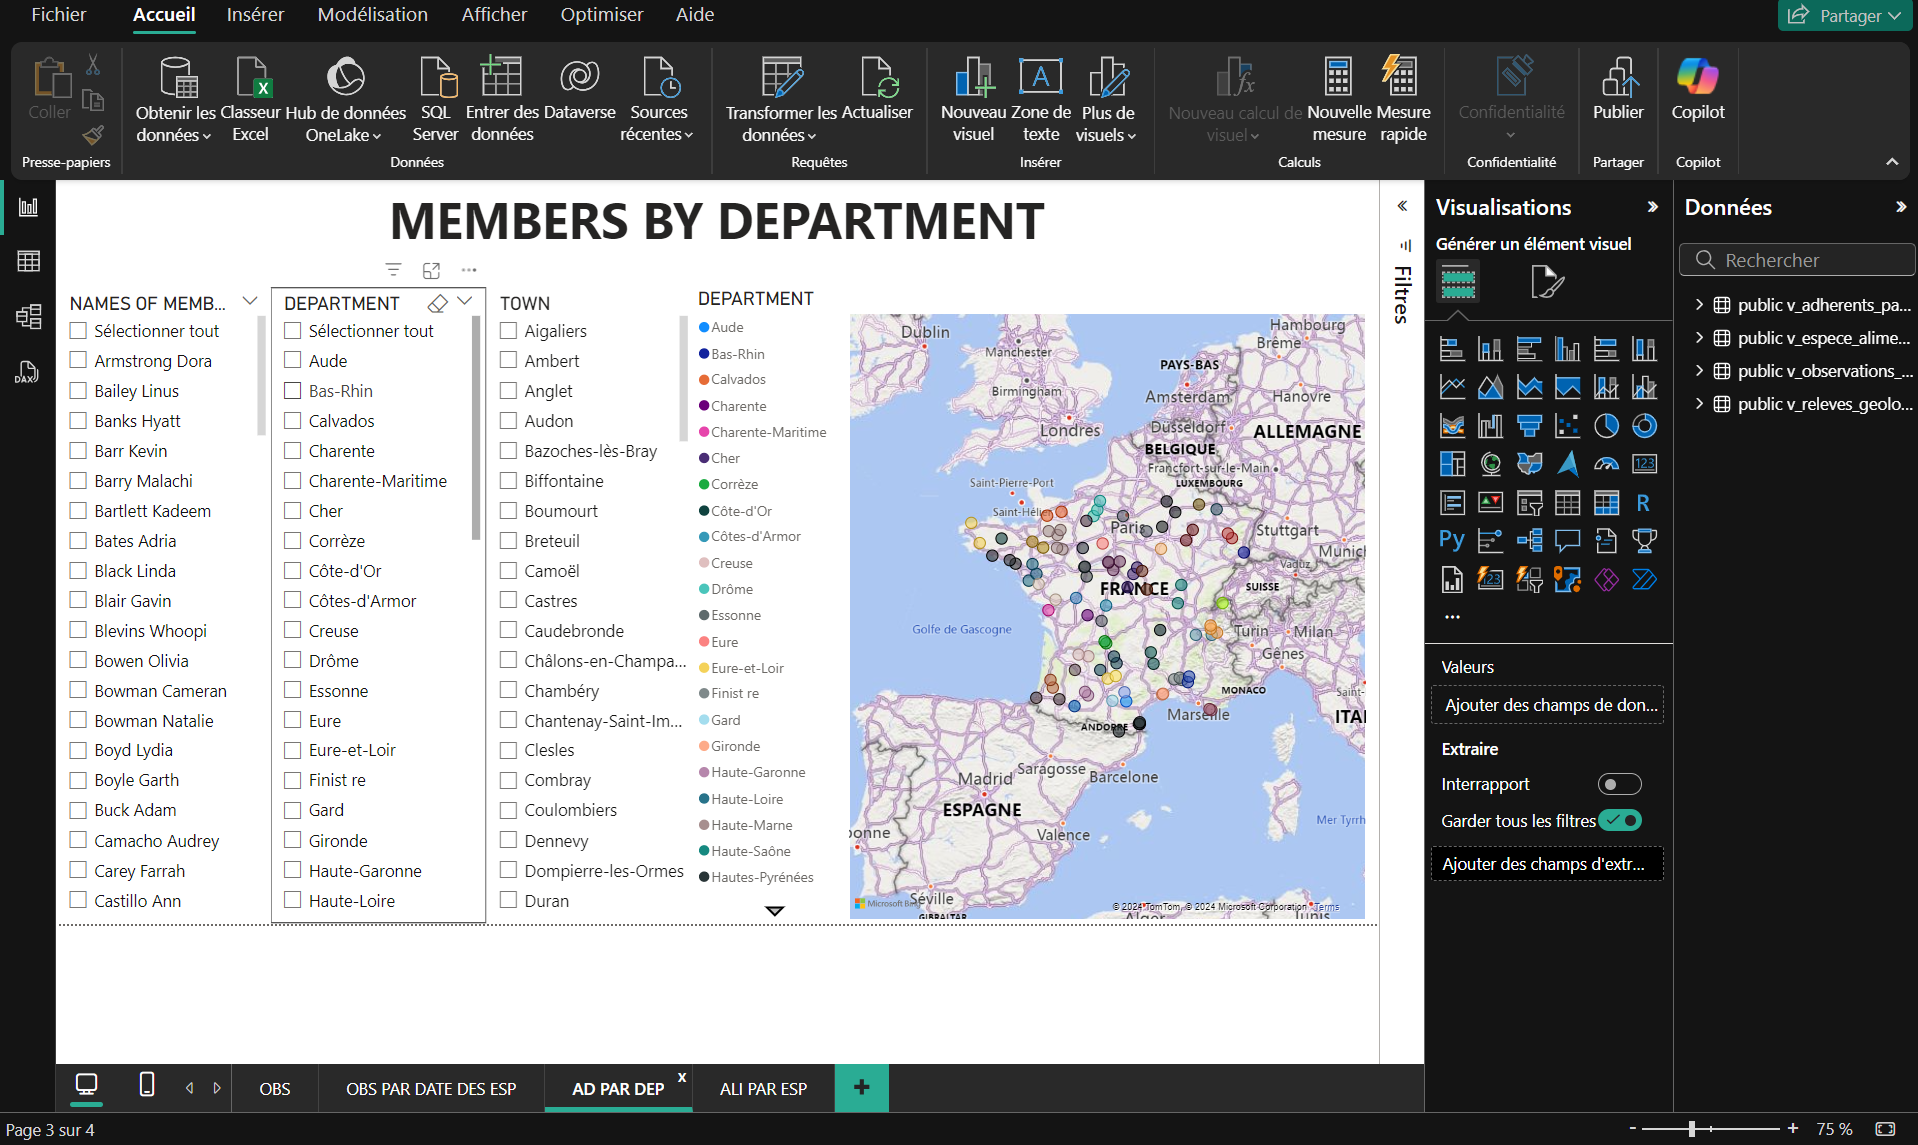
Interactive Power BI dashboard
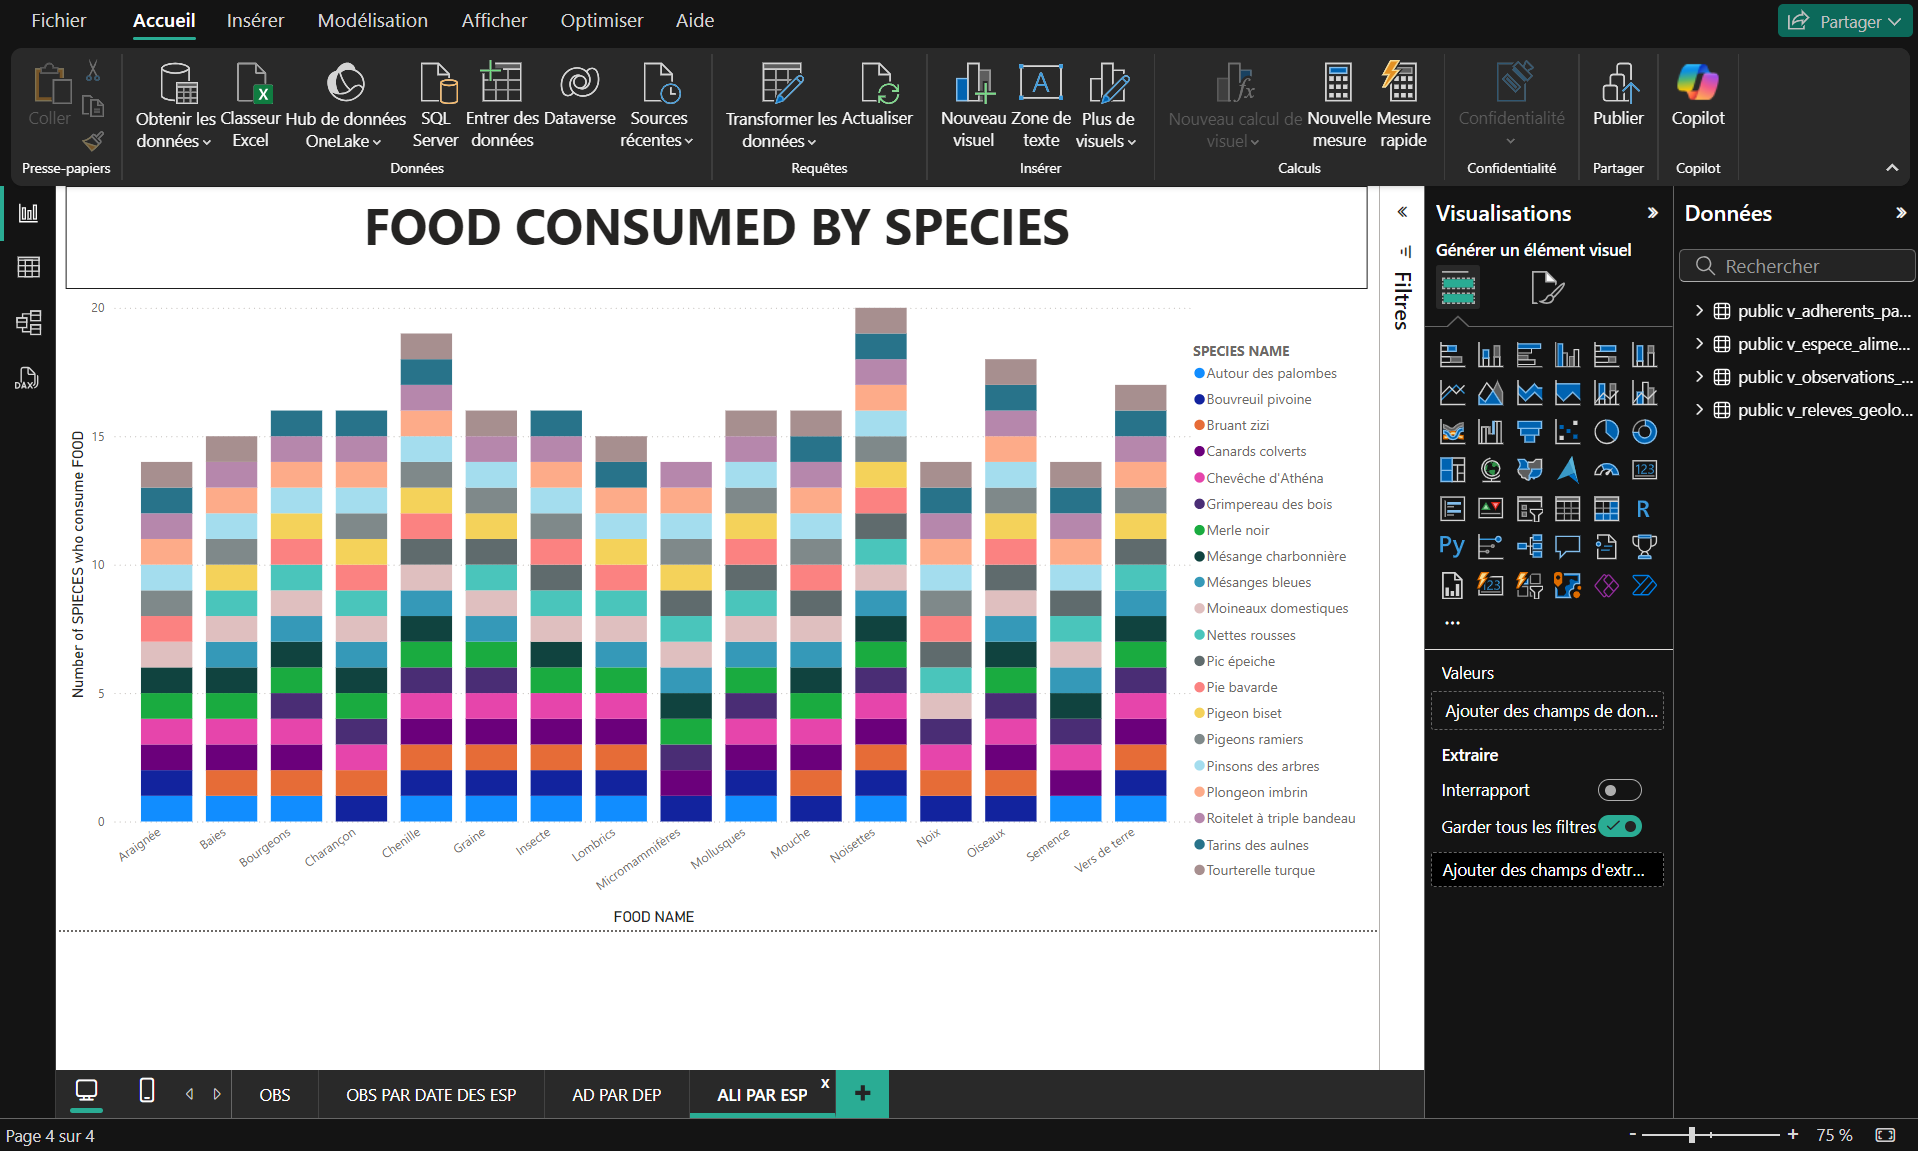
In-depth analysis with Power BI